The complementary nature of probability and statistics in simulation engineering
 July 17, 2021
 1425 words
 7 minutes to read
Last Updated: April 3, 2022
7 minutes to read
Last Updated: April 3, 2022

The fields of probability and statistics deal with hypothesizing, analyzing, and summarizing - extracting predictions and understanding data. While often grouped, probability and statistics involve largely distinct mental frameworks and methodologies. Yet introductory study paths typically teach the basic concepts of probability and statistics together without clearly differentiating the fields. This post will show how probability and statistics are distinct, yet complementary in simulation engineering. Both of these disciplines generalize empirical results associated with a single experimental situation.
Probability is a way of thinking. It should be learned for its own sake. In this century probability has become an integral component of virtually every area of thought. We expect that understanding probability will be as important in the 21st century as mastering elementary arithmetic is in the present century.
– Falk and Konold (1992, p. 151).
Contrast and compare probability theory with statistics
Probabilities are numerical qualities that describe the chance of an event occurring. At a higher level, probability theory looks at axioms and probability structures with an eye towards mathematical definitions and predictions. Batanero, et al., (2016, p. 2) states that “The theory of probability is, in essence, a formal encapsulation of intuitive views of chance that lead to the fundamental idea of assigning numbers to uncertain events.”
On the other hand, statistics help us study data through analysis and interpretation to extract meaningful insights and patterns. Reality is not deterministic, nor is the science that reality is founded upon. Reality is laden with uncertainty. Measurement within science exhibits a range of errors, which, when coupled with the range of variables that impact any data stream, suggest a critical level of ignorance about what goes on in science and engineering around us.
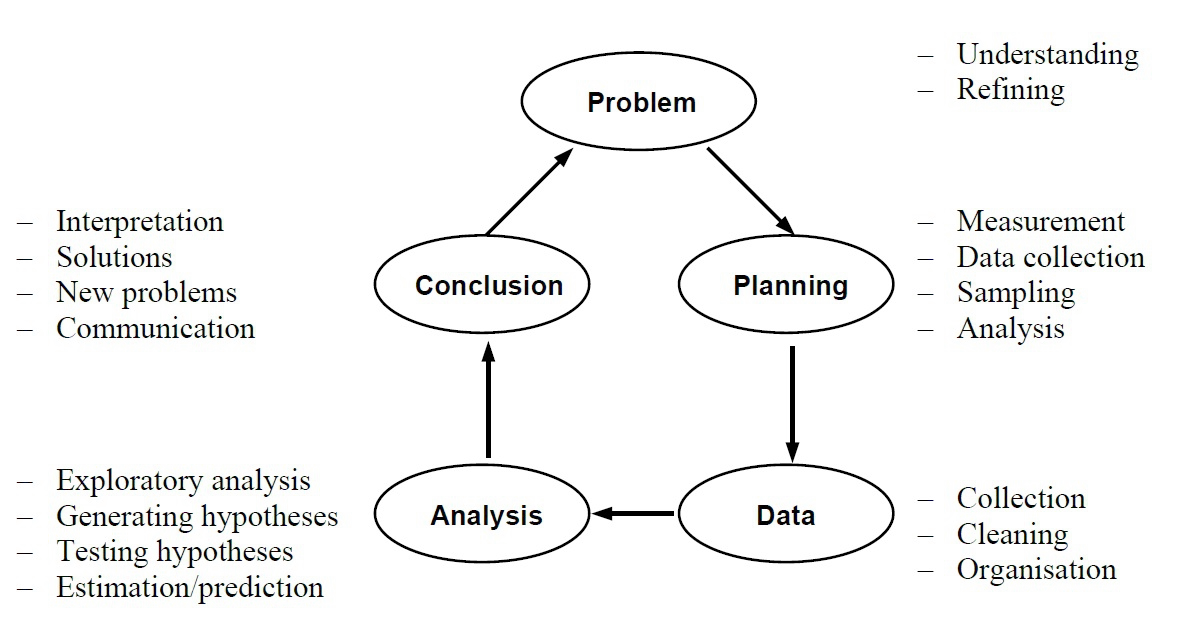
Batanero and Borovcnik (2016, p. 12) proposed that “Statistical knowledge involves thinking in models, being able to apply proper models in specific situations, considering the impact of assumptions, deriving and checking the results, and interpreting them in the context.” A research cycle of Problem, Planning, Data, Analysis, and Conclusion (PPDAC) comprises an approach to solving statistical problems (see Figure 1.1).
Future events vs. past events
Consider an example. During the flip of a coin, probability theory would facilitate a prediction about whether a coin will flip as heads or tails and more complex scenarios like three of the next five flips being heads. Traditional statistical analysis is more focused on observation than prediction – tracking the result of large numbers of coin flips, tabulating results, and defining the pattern of results with precision. The probabilistic analysis predicts the likelihood of future events, while the statistician analyzes the frequency of past events.
“There are two main approaches for the definition of the term probability in the objective school: The classic approach (Laplace) – The probability of an event is the ratio between the numbers of results that fulfill the desired event and the number of elements in the sample space, when the sample space is finite and uniform. The experimental (frequency) approach – the probability of an event is the value at which the relative probability stabilizes when the number of experiments is large enough. The alternative approaches are different from one another and none of them is suitable for all situations.”
– Kvatinsky and Even (2002, p. 3)
Probabilistic and statistical analysis are naturally complementary. For example, while probabilistic analysis creates hypotheses about the likelihood of event occurrence, statistical analysis can later reaffirm those predictions. Time is the variable that unifies probability and statistics.
Monte Carlo simulations – an example of stochastic simulations
Both probability and statistics play a vital role in any simulation engineering project. Consider stochastic simulations, such as Monte Carlo simulations. For a sports application of Monte Carlo, let’s review the prediction of match outcomes between two football teams. Monte Carlo simulation would stochastically generate predicted results - a binary flip of a biased coin. The bias – (the extent to which one team is favored) – is based on several internal and external factors such as the quality of players on both sides, who might be sitting out due to medical injuries, and the location where the match is played.
Statistics offers a way to quantify these factors, i.e., statistical analysis of the number of games the teams have won (at each particular venue), how individual player and squad participation has influenced game outcomes, etc. Statistics then feeds into probability (and stochastic models), which generates results that can be analyzed statistically (i.e., the predicted game outcomes). From this vantage point, the probability is the mathematical narrative of simulation inputs, and statistics is the mathematical narrative of simulation outputs.
Bayesian method of interpreting probability through Bayesian statistics
More advanced ways exist where probability and statistics combine. The Bayesian method of interpreting probability through Bayesian statistics is an example. Instead of defining probabilities as a single fraction, we interpret an event’s probability to be an abstract quantity (typically a numerical range of values). Such Bayesian statistics are a widely accepted tool for evaluation and validation, especially in the application of artificial intelligence and machine learning.
“Bayes’ rule is used to update a prior distribution. The prior distribution is the list of possible values for a parameter and their associated probabilities fixed before collecting experimental data. The aim of Bayesian inference is updating this prior distribution with the new data. The posterior distribution combines the prior distribution and the experimental data.” (Batanero and Borovcnik, 2016, p. 196)
We can also see advanced cases of probability and statistics through the lens of assumptions. Statistics, in this sense, evaluate the prevailing conditions under which an hypothesis is formulated through probability theory. Another example would be where statistics try to rationalize the uncertainty that probability theory introduces in the prediction of an event.
Next steps
Simulation professionals need to be fully aware of the nuances of both probability theory and statistics throughout the simulation project lifecycle. Data needs to be applied accurately, precisely, and correctly, especially for simulations built on many approximations, assumptions, and random variables. Probability theory and statistics encompass largely distinct frameworks. Still, they come together when we think about problems in terms of time—probability theory being focused on the future and statistics on the past. We can also think of probability theory as a powerful tool for simulation inputs (e.g., input modeling) and statistics as a formidable tool for simulation outputs (e.g., results from interpretation).
Garfield and Ben‐Zvi (2007, p. 387-389) reaffirmed eight principles for teaching probability and statistics to individuals relevant today if you embark upon the application of probability and statistics within simulations:
- Individuals learn by constructing knowledge
- Individuals learn by active involvement in learning activities
- Individuals learn to do well only what they practice doing
- It is easy to underestimate the difficulty individuals have in understanding basic concepts of probability and statistics
- It is easy to overestimate how well individuals understand basic concepts
- Learning is enhanced by having individuals become aware of and confront their errors in reasoning
- Technological tools should be used to help individuals visualize and explore data, not just to follow algorithms to pre-determined ends
- Individuals learn better if they receive consistent and helpful feedback on their performance
If team members need to refamiliarize themselves with the concepts and practice of probability theory and statistics, then we would suggest playing with some of the tools on the market to support upskilling:
- TinkerPlots Software for dynamic data exploration, data visualization, and modeling; and
- Fathom Dynamic Data Software that’s fun and effective for learning data analysis and statistics.
References:
Batanero, C., & Borovcnik, M. (2016). Statistics and probability in high school. Springer.
Batanero, C., Chernoff, E. J., Engel, J., Lee, H. S., & Sánchez, E. (2016). Research on teaching and learning probability (p. 1-33). Springer Nature.
Falk, R., & Konold, C. (1992). The psychology of learning probability. In F.S. Gordon & S.P. Gordon (Eds.), Statistics for the twenty-first century (pp. 151 - 164). Mathematical Association of America.
Garfield, J., & Ben‐Zvi, D. (2007). How students learn statistics revisited: A current review of research on teaching and learning statistics. International Statistical Review, 75(3), 372-396.
Heitele, D. (1975). An epistemological view on fundamental stochastic ideas. Educational Studies in Mathematics, 6, 187–205.
Kvatinsky, T., & Even, R. (2002). Framework for teacher knowledge and understanding about probability. In Proceedings of the Sixth International Conference on Teaching Statistics (CD). Cape Town, South Africa: International Statistical Institute.
Wild, C. J., & Pfannkuch, M. (1999). Statistical thinking in empirical enquiry (with discussion). International Statistical Review, 67(3), 223-265.